
This is the sixth monthly review for 2015. Other reports for 2015 available:
June Key Statistics
[table “” not found /]As part of reviewing the month of June, it should be acknowledged that these results also reflect the impact of my first Twitter Ad campaign. The upturn in traffic is interesting and clearly attributed to not just the campaign but partly the seasonality and currency of the content – specifically Apple’s launch of Watch and hosting of WWDC generated content which I took the opportunity to promote.
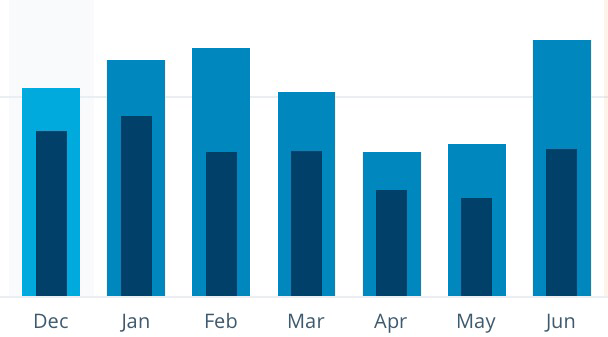
Across all key metrics, there has been a noticeable increase in traffic, reversing the previous month’s trend of gradual decline in viewership and visitors. 50% increase in visitors, with an even greater increase in views – suggesting not only are people visiting, but they are also exploring the site. The best metric here is the 74% increase in average views per day.
The mid-year website update provided a brief mention of the Twitter campaign which was a targeted campaign. The initial set-up and configuration was all self-determined. Early on within days on initiating the campaign, a Twitter staff member based in Sydney reached out to assist and provide advice on how to tweak and improve the campaigns effectiveness. This involved adjusting keywords, changing the type of Twitter promotion content – from promoted tweets to customized web cards with specific calls to action. This campaign was initially defined without an end date, but true to my original experimental intention, the campaign has completed with the month of June over.
Key insights that are shareable here include 11,620 impressions. An impression is the technical online marketing term for an opportunity where the Twitter advertisement appears. That translates into the everyday language as people on Twitter saw 11,620 ads promoting XBOP. 134 clicks mean that of the 11620 opportunities over 1% of them resulted in a click / view of XBOP. 221 engagements were recorded, including re-tweets so the overall engagement was closer to 2%. Now, correlating these statistics reported by the Twitter Ads dashboard to the WordPress/Jetpack statistics suggests a disconnect. The only conclusion I can form is that in addition to the 134-221 click-throughs from Twitter, other channels provided the bulk of the total 750 visitors. Based on this data, it would suggest that the Twitter campaign contributed a quarter of the increase.
A recent comparison of various websites I have a stake in managing revealed that of all the organizations, XBOP ranks seconds only to my church – Clayton Church. Whilst that site receives a much higher rate of visitors, my website consumes a lot more bandwidth because of the high use of images in my content/posts. It is also interesting to observe that I am regularly posting and keeping content up-to-date, whereas the church website has a less frequent content update cycle. This is not a bad thing, it merely reflects the fact that the church is not utilizing their online presence in the style of a blog. Other websites that I manage or have a vested interest in are earlier in their stages of development/life-cycle, meaning that their content is more informational/static rather than blog and interactive.
June saw 14 posts which was a 75% increase from the month of May. The context needs to be appreciated that the month of May was a lighter month in terms of publications. A short burst of content activity over four consecutive days in the middle of June.