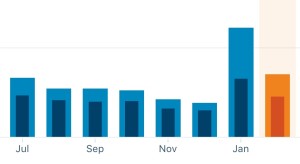
Reporting Metrics
Three new calculated metrics are being added to the reports and data that drives the above tables:
- yoy %, which stands for “Year on Year % change”. It compares the monthly data against the same month for the previous year. New insights are possible via this metric on the long-term range, comparing data between the same month now and a year ago. Throughout 2016, it will be challenging to improve on what was a very good year. The year-on-year metric extends to the earliest possible moment in my dataset – June 2014 – the first year anniversary of XBOP being powered by WordPress. Having a great year will be reflected in a continuous range of positive yoy % data – which is true in my dataset for the first 16-month period. XBOP had a 16-month period of continuous growth. As of February, we have now experienced a five-month period of negative yoy % data, a reflection of the fact that the 16-month period of growth could not be sustained. The first month of a negative yoy % was October 2015, which was a whole year after the explosive growth took place. Having sustainable long-term growth is important, so the later half of 2016 will be an important period to monitor this statistic over.
- 3ma, which stands for “Three Month Moving Average”. The introduction of a three-month moving average metric helps to provide balance and a shorter period of analysis compared to the year-on-year metric. The thinking and methodology behind a three-month moving average is fairly common in business reporting where a direct comparison to the immediate previous month will help tell one story, but a more complete understanding is reached via the use of a three-month moving average. As the term/name suggests, an average of a three-month period is taken – that is the reporting/current month plus the next two previous months. It provides the direction of a current trend and helps to provide a smoother trend instead of the more granular and potentially erratic shifts from day to day or month to month. The “moving” part of the definition reflects the fact that every month, the new period drops a month and moves to the new reporting period and adds the current reporting month to maintain the three-month duration length. The 3ma helps to normalise outlier data. October 2014 saw a huge increase in visitors and views, and this could have been a one-off data spike, but then November confirmed the trend, and thus the 3ma reflected this growth. Unfortunately the growth was not sustainable so in the early months of 2015 the 3ma corrected to reflect a more normalised average. the 3ma definitely provides the clearest sign that XBOP is no longer the baby start-up from 2013 (averaging 67 for the first twelve calendar months of 2013-2014) since the trough for 2015 during my September – December absence saw the 3ma bottom out at 330 (December 2015). A similar “blip” effect for January 2016 will either be confirmed or factored into the emerging trend for 2016.
- 3ma %, or the “Three Month Moving Average – Change” is a calculation on a calculation. It compares the change from month to month that the 3ma is undergoing. Not only do we get a direction of the trend, but now we also can see how that direction has changed from month to month. Positive change is the target, but even with this metric, low and steady growth would suggest a sustainable growth trend versus the exponential and explosive growth that large numbers reflect.
In part, I enjoy these monthly review reports because of the statistical analysis opportunity it offers. The addition of the above three new reporting metrics constitutes a website update in itself because the reporting capability and output is very much a part of what makes XBOP. Just as any solution development and delivery in the corporate world entails new functionality, so too is reporting (product, operational, etc…) an intrinsic part of a solution scope. These new metrics reflect a commitment to deriving meaningful insights from the dataset, which is now in a very nice state of maturity – the core traffic data captured every day by WordPress and the Jetpack plugin provide a holistic understanding of XBOP.

The image on the left shows the regular posting frequency that I have managed to maintain throughout the month of February. With the one exception in the final week, the every-other-day cycle has persisted, in part because the writing series on the Samaritan’s Purse Discovery Trip ensured a regular publishing cycle.
The recent completion of the Memory Verses writing serial is a good win in recent times. Whilst the delay was not intentional, as I mention in the concluding article, God had timed it perfectly given the verse and chapter from 1 Corinthians 10 had relevance during the Samaritan’s Purse Discovery Trip! Only He could have known that this was how it was intended to play out.
As March and the Autumn season commences, the Fall writing themes that are planned have a whole publication timetable mapped out. Continuation of existing themes will dove-tail with new material planned. A new series was birthed just in the last days based on simple material readily available but highly relevant and strategic to the nature of XBOP. I will withhold revealing some of the actual new material here but some themes have already been previously established and are clearly works still in progress – Lego and public transport.

You must be logged in to post a comment.